Posts

Showing posts with the label beat the streak

Beat the Streak Day 17: Coordinated Pick Selection
Image
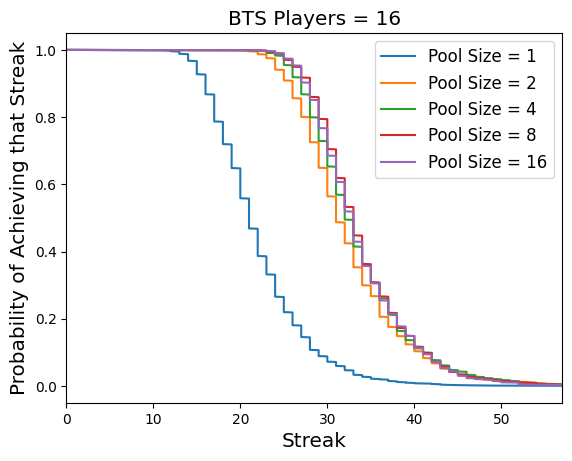
My current best pick selection model for BTS achieves roughly 78% accuracy.  Looking at the table from Day Six , we can see that with an optimal pick selection strategy, my odds of beating the streak are roughly 11,800 to 1, or roughly a 0.01% chance of winning.  In this blog post, I will explore methods for boosting this probability by coordinating picks across multiple accounts (e.g., friends, family, other BTS enthusiasts, etc.) To the non-mathematically inclined, one might think that with $k$ accounts our probability of beating the streak as a group would simply multiply by $k$.  This simple formula is not correct, however, although it is an upper bound.  If each account has a probability $p$ of beating the streak, and there are $k$ accounts, the probability that at least one account beats the streak would be $1 - (1 - p)^k$ if we (incorrectly)  assume independence between accounts .  For small $p$ and small $k$, this is pretty close to to the upper bou...

Beat the Streak Day 16: Vegas Odds and Sports Betting

Image
I recently have been seeing many advertisements for sports betting platforms like DraftKings and Fanduel, and since those are somewhat related to beat the streak, I thought it would be interesting to look into these things a little more. In my search I came across a website that lists Vegas odds for various sports books on various bets.  Among those bets is one highly related to beat the streak: a bet that a given batter will "record a hit" in a given game.  This is exactly the essence of the beat the streak: identifying a batter most likely to record a hit.  In my effort to develop models for BTS, I have several approaches to estimate the probability that a player will record a hit in a given game.   So three natural questions arise: 1. Is Vegas good at BTS?  That is, is the implied probability of a hit given the Vegas odds a better estimate of the true probability than some of the models I've talked about in this blog? 2. Can the Vegas odds be a useful f...

Beat the Streak: Day 11

Image
In a previous blog post , I showed that simply looking at empirical frequencies to estimate hit probabilities can be misleading, as there is a positive bias that is introduced when we take the maximum over a bunch of empirical frequencies.  This bias will incorrectly lead us to believe that the probability of a hit for the best batter is higher than it truly is, which is clearly a problem from the perspective of beat the streak.   It is fairly straightforward to correct for the bias.  In this blog post, I will explain how, and discuss the implications of the bias-corrected hit probabilities.  Recall from the previous blog post, that our setup is as follows: Suppose we have a collection of batters $ i=1, \dots, 250$, and each batter has a certain (unknown) probability of getting a hit in a given game $p_i$.  Moreover, assume each batter plays in $162$ games, and that the outcomes for each player across games is i.i.d.  For the purposes of this problem a...

Beat the Streak: Day Seven

Image
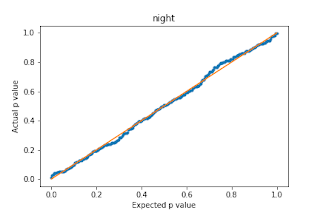
In this blog post, I discuss questions of the form: “Does batter X perform better at home or away?   At day or night?   Against lefties or righties? On Friday or Monday?”   What I found was a little bit surprising.   Take for example the batter Daniel Murphy.   When you look at his data from 2011 - 2017, you will see that he got a hit in 29.85% of 1424 plate appearances during day games and he got a hit in 26.97% of 2673 plate appearances during night games.   This is a pretty meaningful difference, but is it statistically significant?   In other words, could this difference be explained purely by chance?   To answer this question, we can perform a chi squared test under the null hypothesis that the true probabilities are the same.   When we do this we get a chi squared value of 3.35 and a corresponding p value of 0.067.   Thus, we can reject the null hypothesis that the true underlying probabilities are the same at the 90% confiden...

Context-Dependent Pitch Prediction with Neural Networks

This semester I took the machine learning class at UMass, and for my final project I developed models for predicting characteristics of pitches based on the context that they were thrown in.  The context consists of relevant and available information known before the pitch is thrown, such as the identities of the batter and pitcher, the batter height and stance, the pitcher handedness, the current count, and many others.  In particular, I looked into modeling the distribution over pitch types and locations.  This problem is challenging primarily because for a particular context (a specific setting of the different features that make up the context), there is usually very little data available for pitches thrown in that context.  In general, for each context feature we include, we have to split up our data into $k$, groups where $k$ is the number of values that the context feature can take on (for batter stance it is $k=2$, for count it is $k=12$, etc).  Thus, de...

Beat the Streak: Day Six

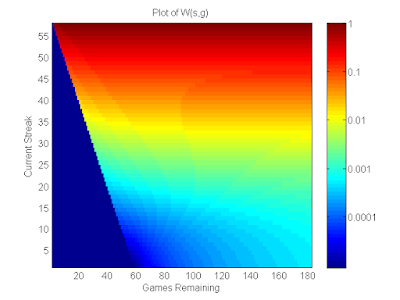
In this blog post, I am going to show why the work I did on  Day Three  is so important, and how using the strategy I outlined in that post can improve your odds of beating the streak by a factor of 5-10!  On day three, I analyzed the situations under which you should select a player who you think will get a hit, as opposed to not selecting that player, and instead maintaining your current streak until the next day.  In summary, I found that your decision should be guided by your current streak, the number of games left in the season, your confidence in the player (how likely is he to get a hit?), and the distribution of likelihoods across all games in the season.  After solving for the optimal strategy, I was able to approximate the probability of winning under that strategy by making some simplifying assumptions about the probability distribution of the best player getting a hit on a given day. I'm not going to get too deep into the math in this blog post, b...

Beat the Streak: Day Five

Image
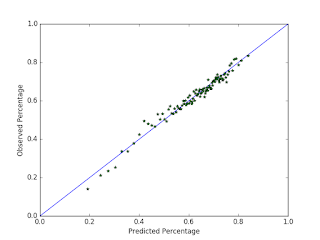
With the recent high offensive production in the mlb, many people have amassed large streaks in the Beat the Streak contest.  The current leader has a streak of 41 games, which he got by picking exclusively red sox players.  Many other people have streaks in the high 30s, and I have a streak of 19 myself right now.  It seems like a lot more people have been getting longer streaks this year.  Some of this is probably due to the fact that more batters are getting hits this year than they have in the past, but it is probably also due to MLB.com's new pick selection system, which makes it easier than ever to make high quality picks using whatever strategy you want.  I would not be surprised if this is the year somebody wins.  If that's the case, this could be one of my last blog posts on this topic.     In this blog post, I am going to evaluate my current pick selection strategy  by testing it on data from 2015.  My data consists of a list ...

Beat the Streak: Day Four

In this blog post, I will introduce an idea I recently came up with to predict the most likely players to get a hit in a given game based on situational factors such as opposing starter, opposing team, ballpark, and so on. I have not written much in this blog on this topic, although I did some work on this topic last fall which you can find here . In that work, I had the chance to explore a bunch of ideas that I had, but ultimately had to back up a few steps and rethink my approach. I think the ideas are still valid, and will continue refine them as time permits. A few weeks ago, I came up with a new approach that is completely different from my other approaches so far, and I will share it in the rest of this post. Defining the Problem Before we dive into the math, let's talk about what exactly we are trying to do. The end goal is to pick the player who is most likely to get a hit on a given day based on factors associated to the games for that day. Some of these facto...

Beat the Streak 2016: Looking for Help

For anybody who is interested in developing strategies to beat the streak using statistics or machine learning for the 2016 season and beyond, get in touch with me at RMcKenna21@gmail.com. The past six months or so I have been developing statistical models and designing algorithms to automate the pick selection process, and now I am looking for like-minded people to help me improve my methods. If you are interested in working together on this problem, let me know and we can start sharing ideas. I have a repository and a fairly nice python framework for predicting the most likely players to get a hit every day. However, the accuracy of my models are still ~10% lower than my target. I think if we can develop a model that correctly picks a player 83-85% of the time, then we have a pretty decent shot at winning this thing (by "pretty good" I mean like 1000 to 1 odds). To get a sense of what I've been doing to solve this problem so far, check out this paper and this...

Beat the Streak: Day Three

Image
In order to maximize your probability of beating the streak, you should (1) predict the probability that a batter will get a hit in a given game given the game parameters and (2) determine if it's worthwhile to risk your current streak in order to possibly improve it by 1 or 2 games. In this blog post, I outline my solution to (2). In previous blog posts, I've hinted at what I do to solve (1) and will continue that discussion in a later blog post. Motivation When your current streak is short, the optimal strategy is to pick the best player every day, regardless of how likely their probability of getting a hit is (to a certain extent). However, as your streak grows, you have an important decision to consider: is it better to pick the best player today and possibly lose your current streak, or skip picking a player and instead maintain your current streak. Naturally, this decision should be guided by the players probability of getting a hit, as well as the distribution of the...