Beat the Streak: Day Five
With the recent high offensive production in the mlb, many people have amassed large streaks in the Beat the Streak contest. The current leader has a streak of 41 games, which he got by picking exclusively red sox players. Many other people have streaks in the high 30s, and I have a streak of 19 myself right now. It seems like a lot more people have been getting longer streaks this year. Some of this is probably due to the fact that more batters are getting hits this year than they have in the past, but it is probably also due to MLB.com's new pick selection system, which makes it easier than ever to make high quality picks using whatever strategy you want. I would not be surprised if this is the year somebody wins. If that's the case, this could be one of my last blog posts on this topic.
In this blog post, I am going to evaluate my current pick selection strategy by testing it on data from 2015. My data consists of a list of observations, where each observation contains information specific to the situation faced by a particular batter on a particular day, as well as whether that batter got a hit on that day. Using a slightly modified version of the idea outlined in my previous blog post on this topic, I create an initial model from the data in 2014. Then I partition the 2015 by date and iterate through each date in order. For a particular date, I query my model to estimate hit probabilities for every batter on that day, then update the model by adding the data for that day and recomputing the parameters for the statistical model. After iterating though every date, I have estimated hit probabilities for every player on every day. I also have the observed outcome for every player on every day from the historical data. With these two pieces of information, I evaluate the quality of my predictions by comparing the probabilities with the observed events. Note that for the purposes of beat the streak, I am only interested in the most likely players to get a hit on a given day (and their associated likelihoods). However, I want to understand my model at a more general level, so I evaluate my predictions for all batters for all dates (even the ones that aren't likely to get a hit).
I evaluate the prediction quality by building a calibration curve. This is constructed by sorting the predicted probabilities, then chunking up these predictions and the observations into 100 groups each. For every (prediction, observation) group, I compute the mean hit probability in the prediction group as well as the proportion of hits in the observation group, and then plot the points. A good calibration curve is one where the majority of points occur at or near the diagonal. Additionally, the further the points are away from the mean, the better we can consider the model (as long as the points are still along the diagonal, that is).
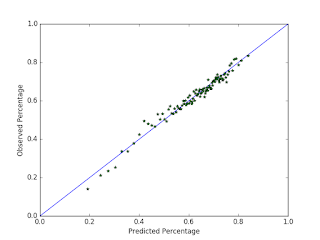

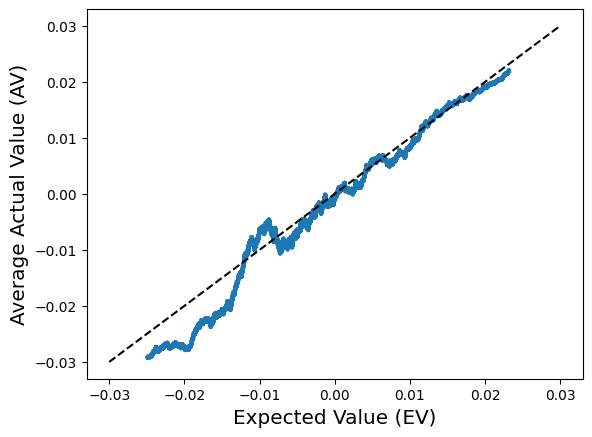
The first plot is a calibration curve of my model on the 2014 data. The fact that most points are on or near the diagonal indicates that the parameters of my statistical model fit the data really well. Further, by looking at the extreme values, we can see that my model (correctly) predicts some situations to be highly favorable for the batter, with some batters having a 90% chance of getting a hit. However, in the second plot, the model isn't so good. In this case, past observations are used to build the model that is used to predict future events. This strategy simulates how I would use this system in reality, as I am constrained to using historical data only to make my daily picks, and it gives me an idea of how I would have done with this model if I had used it in 2015. As the plot points out, the probabilities aren't very well calibrated for the people who are most likely to get a hit (according to my model that is). The observed probability of a hit caps off at about 73% under my model. This is nowhere near where I need to be to have a shot at winning this thing, for two reasons. First, if the accuracy is too low (say, below 80%), then it's way too hard to amass a 57 game hitting streak. Second, if the probabilities aren't well calibrated, then I can't use my ideas from this blog post to maximize my chances of winning by deciding which days to pick players on and which days to pass on.
A made similar observations for the models I tried in the past, such as the log5 formula, logistic regression, and neural nets: they all fit the training data very well, but their predictions are not well calibrated for unobserved data. This is challenging barrier that I need overcome, but I don't see an obvious way forward. But now that I have a good way to evaluate any model on the 2015 season, I can construct and experiment with a lot more models in a lot less time, and so I can find out exactly what does and does not work.
In this blog post, I am going to evaluate my current pick selection strategy by testing it on data from 2015. My data consists of a list of observations, where each observation contains information specific to the situation faced by a particular batter on a particular day, as well as whether that batter got a hit on that day. Using a slightly modified version of the idea outlined in my previous blog post on this topic, I create an initial model from the data in 2014. Then I partition the 2015 by date and iterate through each date in order. For a particular date, I query my model to estimate hit probabilities for every batter on that day, then update the model by adding the data for that day and recomputing the parameters for the statistical model. After iterating though every date, I have estimated hit probabilities for every player on every day. I also have the observed outcome for every player on every day from the historical data. With these two pieces of information, I evaluate the quality of my predictions by comparing the probabilities with the observed events. Note that for the purposes of beat the streak, I am only interested in the most likely players to get a hit on a given day (and their associated likelihoods). However, I want to understand my model at a more general level, so I evaluate my predictions for all batters for all dates (even the ones that aren't likely to get a hit).
I evaluate the prediction quality by building a calibration curve. This is constructed by sorting the predicted probabilities, then chunking up these predictions and the observations into 100 groups each. For every (prediction, observation) group, I compute the mean hit probability in the prediction group as well as the proportion of hits in the observation group, and then plot the points. A good calibration curve is one where the majority of points occur at or near the diagonal. Additionally, the further the points are away from the mean, the better we can consider the model (as long as the points are still along the diagonal, that is).

The first plot is a calibration curve of my model on the 2014 data. The fact that most points are on or near the diagonal indicates that the parameters of my statistical model fit the data really well. Further, by looking at the extreme values, we can see that my model (correctly) predicts some situations to be highly favorable for the batter, with some batters having a 90% chance of getting a hit. However, in the second plot, the model isn't so good. In this case, past observations are used to build the model that is used to predict future events. This strategy simulates how I would use this system in reality, as I am constrained to using historical data only to make my daily picks, and it gives me an idea of how I would have done with this model if I had used it in 2015. As the plot points out, the probabilities aren't very well calibrated for the people who are most likely to get a hit (according to my model that is). The observed probability of a hit caps off at about 73% under my model. This is nowhere near where I need to be to have a shot at winning this thing, for two reasons. First, if the accuracy is too low (say, below 80%), then it's way too hard to amass a 57 game hitting streak. Second, if the probabilities aren't well calibrated, then I can't use my ideas from this blog post to maximize my chances of winning by deciding which days to pick players on and which days to pass on.
A made similar observations for the models I tried in the past, such as the log5 formula, logistic regression, and neural nets: they all fit the training data very well, but their predictions are not well calibrated for unobserved data. This is challenging barrier that I need overcome, but I don't see an obvious way forward. But now that I have a good way to evaluate any model on the 2015 season, I can construct and experiment with a lot more models in a lot less time, and so I can find out exactly what does and does not work.
Comments
Post a Comment