Posts

Showing posts from January, 2022

Beat the Streak: Day Nine

Image
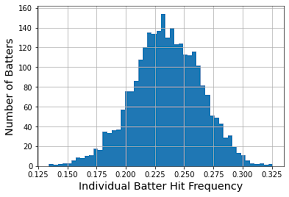
In this blog post, I want to talk about why getting 80% success rate in beat the streak is so challenging.  I believe I identified a mathematical reason for this, which I am going to share in this blog post.   First, lets look at some simple statistics that hint that 80% success should not be out of reach.   In the table below, we are showing the percentage of games with a hit for the most successful batters in 2011-2019. batter % Games with Hit 2011 Jacoby Ellsbury 0.821656 2012 Derek Jeter 0.812121 2013 Michael Cuddyer 0.807692 2014 Jose Altuve 0.803797 2015 Dee Gordon 0.800000 2016 Mookie Betts 0.807453 2017 Ender Inciarte 0.775641 2018 Jose Altuve 0.786207 2019 DJ LeMahieu

Beat the Streak: Day Eight

Image
In this blog post, we will explore three factors that influence the probability of correctly selecting a player to get a hit on a given day.  These are: 1. Individual batter strength, as measured by the proportion of plate appearances that resulted in a hit. 2. Team offensive strength, as measured by the average number of plate appearances per game by the batting team.   3. The position in the batting order. We plot the distribution of these statistics over (batter, year) pairs and (team, year) pairs.  The plots below reveal that the best batters get a hit in about 30% of plate appearances, and the strongest offensive teams average 39 plate appearances per game.  The tables below show the top-performing batters and teams: batter year Josh Hamilton 2010 0.326 Trea Turner 2016 0.324 Jose Altuve 2014 0.319