Posts

Showing posts from April, 2023

Beat the Streak, Day 12: My Grand Vision

Dear blog reader and beat-the-streak enthusiasts alike, Today I want talk about my grand vision for beat-the-streak modelling.  I will explain how I have always envisioned a solution for beat-the-streak, but never actually attempted to solve it this way due the complexity of the project and the limited time I have to work on it.  I hope this could be the year that I start chipping away at putting this grand vision in practice.  In this blog post, I want to explicitly write out this vision along with the sub-problems that would need to be solved to execute this vision.  I have hinted at this vision in some earlier blog posts, but now I want to dive a little deeper on exactly what this idea would entail. In short, this vision requires modeling probability distributions at the finest level of granularity (pitches) and using those as building blocks for coarser granularity models (atbats and game).  The specific models that I am proposing to train / develop are list...

Beat the Streak: Day 11

Image
In a previous blog post , I showed that simply looking at empirical frequencies to estimate hit probabilities can be misleading, as there is a positive bias that is introduced when we take the maximum over a bunch of empirical frequencies.  This bias will incorrectly lead us to believe that the probability of a hit for the best batter is higher than it truly is, which is clearly a problem from the perspective of beat the streak.   It is fairly straightforward to correct for the bias.  In this blog post, I will explain how, and discuss the implications of the bias-corrected hit probabilities.  Recall from the previous blog post, that our setup is as follows: Suppose we have a collection of batters $ i=1, \dots, 250$, and each batter has a certain (unknown) probability of getting a hit in a given game $p_i$.  Moreover, assume each batter plays in $162$ games, and that the outcomes for each player across games is i.i.d.  For the purposes of this problem a...

Beat the Streak: Day 10

Image
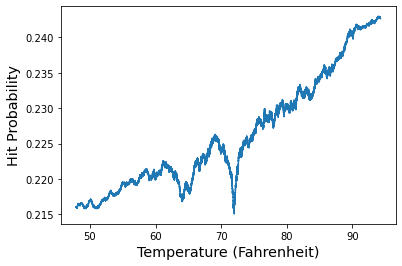
In this blog post, we augment our dataset with information about weather, and looking at how different features pertaining to weather affect the probability of getting a hit. Specifically, we will look at 3 weather-related variables: temperature, wind speed + direction, and precipitation.   Temperature We will begin by analyzing the effect of temperature on the probability of getting a hit.  Our data consists of plate appearances from 2010 - 2021, or roughly 2 million records.  For each plate appearance, we have access to the temperature (presumably, this corresponds to temperature at the start of the game ) and the outcome (hit / no hit).  We sort this dataset by temperature, and then compute a rolling mean of width 100,000.  This allows us to get the discrete events (hit / no hit) and turn them into probabilities.  The plot below shows the trend.  This shows that higher temperatures lead to increased hit probability.  Specifically, going f...