Beat the Streak: Day 11
In a previous blog post, I showed that simply looking at empirical frequencies to estimate hit probabilities can be misleading, as there is a positive bias that is introduced when we take the maximum over a bunch of empirical frequencies. This bias will incorrectly lead us to believe that the probability of a hit for the best batter is higher than it truly is, which is clearly a problem from the perspective of beat the streak.
It is fairly straightforward to correct for the bias. In this blog post, I will explain how, and discuss the implications of the bias-corrected hit probabilities. Recall from the previous blog post, that our setup is as follows:
Suppose we have a collection of batters $ i=1, \dots, 250$, and each batter has a certain (unknown) probability of getting a hit in a given game $p_i$. Moreover, assume each batter plays in $162$ games, and that the outcomes for each player across games is i.i.d. For the purposes of this problem abstraction, let's assume $p_i \sim Beta(68, 32)$. Our observation is $n_i \sim Binom(162, p_i)$, and we'd like to estimate $p_i$ for each batter $i$.
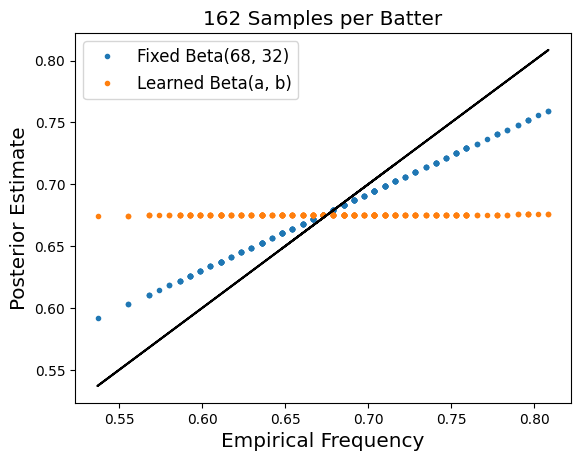
In the absence of prior information information $n_i / 162$ is the maximum likelihood estimator for $p_i$. However, if we incorporate our prior information that $p_i \sim Beta(68, 32)$ it turns out that the maximum likelihood estimator is $ p_i = \frac{68 + n_i}{162 + 68 + 32} $. This new "posterior estimate" for $p_i$ regresses the estimate towards the mean value of $ 0.68 $. The plot below shows how the posterior estimate relates to the empirical frequency. In particular, while the empirical frequency is as large as 0.833, the corresponding posterior estimate is only 0.777. While this posterior estimate is lower, it more accurately reflects the true underlying probability of a hit.

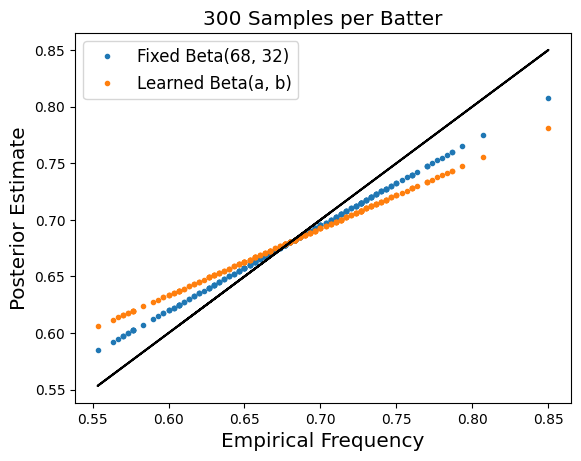
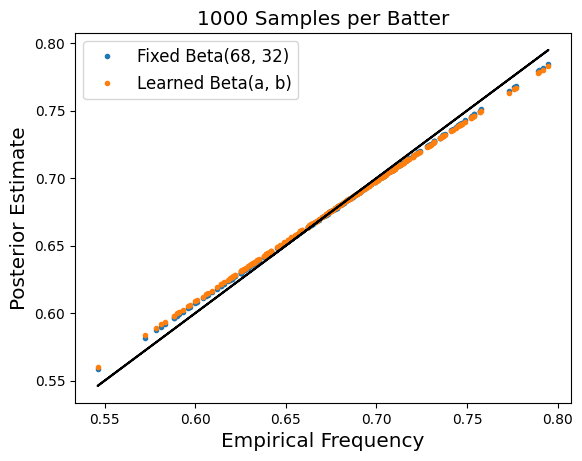
There are two ways in which I would like to generalize the analysis above to better understand this problem. (1) We can treat treat the parameters of the beta distribution (68 and 32 above) as learnable parameters rather than known quantities. (2) we will look at how this trend changes as a function of the number of data points that we sample for each batter. The three plots below demonstrate what happens when we make these two modifications to our setup:
 |
 |
 |
Analyzing Real Data

This is a much more concentrated distribution than we assumed in our idealized setting, and it suggests that the hit probability is rarely above 70%. This is more or less in line with our experiment earlier in the blog post, that found when we learn the Beta(a, b) parameters for $N_i = 162$ the resulting hit probability estimates are nearly constant. Here, they are not quite constant, but are still highly concentrated to the range 65%-68%. Now we instead organize the data so that $N_i$ and $n_i$ correspond to the number of games played and games with hit respectively for a player $i$, aggregating across all years. For the subset of players we consider, the average value of $N_i$ is $477$, much larger than in the single season setting. Repeating the same experiment from earlier finds the optimal Beta parameters are $80$ and $47$ respectively, which gives us the following prior distribution over hit probabilities.

| batter | Posterior Estimated Hit Probability |
|---|---|
| Charlie Blackmon | 0.733585 |
| Michael Brantley | 0.734289 |
| Daniel Murphy | 0.736962 |
| Jose Altuve | 0.740695 |
| Trea Turner | 0.754412 |
| batter | Hit Frequency |
|---|---|
| Daniel Murphy | 0.749113 |
| Jose Altuve | 0.749839 |
| Billy Burns | 0.752577 |
| Scott Podsednik | 0.758242 |
| Trea Turner | 0.774074 |
Comments
Post a Comment