Beat the Streak: Day 10
In this blog post, we augment our dataset with information about weather, and looking at how different features pertaining to weather affect the probability of getting a hit. Specifically, we will look at 3 weather-related variables: temperature, wind speed + direction, and precipitation.


The table below shows the proportion of hits for each value of precipitation. It appears that the hit probability does not have a strong dependence on the precipitation, at least overall.
Temperature
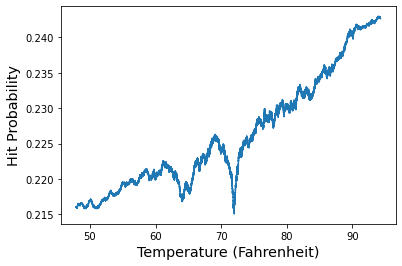
We will begin by analyzing the effect of temperature on the probability of getting a hit. Our data consists of plate appearances from 2010 - 2021, or roughly 2 million records. For each plate appearance, we have access to the temperature (presumably, this corresponds to temperature at the start of the game) and the outcome (hit / no hit). We sort this dataset by temperature, and then compute a rolling mean of width 100,000. This allows us to get the discrete events (hit / no hit) and turn them into probabilities. The plot below shows the trend. This shows that higher temperatures lead to increased hit probability. Specifically, going from 50 degrees to 70 degrees gives approximately a 1% boost to the hit probability. There are two interesting dips occurring at roughly 64 degrees and 72 degrees. It's unclear to me how to explain those dips.
What this means: early in the season, I would avoid selecting players from games occurring in northern states where the weather remains fairly cold. Moreover, mid-season finding games where the projected temperature is in the 90's could be a great way to boost the probability of picking a successful batter or two.
Wind Speed + Direction
Next we will utilize the effect of wind speed and direction on the hit probability. We follow the same basic setup as the previous section, but now we plot a separate line for each wind direction. Results are shown in the figure below. There doesn't appear to be a strong dependence on wind speed for some wind directions, which is surprising to me. Interestingly, stronger winds to left field actually decrease the probability of getting a hit, by about 0.5%. Strong wind from right to left appears to help quite a bit.
If we zoom in and only look at Wrigley Field, a field known to be affected strongly by wind, we get the following plot where wind to center field has a significant influence on the hit probability. This is something to keep an eye on when selecting batters playing at Wrigley field.
Precipitation
| Precipitation | Hit Probability |
|---|---|
| Drizzle | 0.2224 $\pm$ 0.0037 |
| None | 0.2206 $\pm$ 0.0006 |
| Rain | 0.2291 $\pm$ 0.0042 |
| Unknown | 0.2281 $\pm$ 0.0003 |
Comments
Post a Comment