I recently have been seeing many advertisements for sports betting platforms like DraftKings and Fanduel, and since those are somewhat related to beat the streak, I thought it would be interesting to look into these things a little more. In my search I came across a website that lists Vegas odds for various sports books on various bets. Among those bets is one highly related to beat the streak: a bet that a given batter will "record a hit" in a given game. This is exactly the essence of the beat the streak: identifying a batter most likely to record a hit. In my effort to develop models for BTS, I have several approaches to estimate the probability that a player will record a hit in a given game.
So three natural questions arise:
1. Is Vegas good at BTS? That is, is the implied probability of a hit given the Vegas odds a better estimate of the true probability than some of the models I've talked about in this blog?
2. Can the Vegas odds be a useful feature to improve the models I've developed for the purposes of beating the streak?
3. Could the models I've developed for BTS be profitable on these types of bets?
In this blog post, I will primarily focus on (1) and I hope to also do some preliminary experiments on (3). I will leave (2) as an interesting direction to explore in a future blog post.
A Quick Rundown of Vegas Odds
Vegas odds are often represented as a number like -110. This means: in order to win 100 dollars you must bet 110 dollars. Conversely, if the odds are listed as +110, this means you must wager 100 dollars to win 110 dollars. In order to be profitable on a -110 line, the probability of the event happening must be at least 110 / (100 + 110) = 0.5238. Since the sports books need their cut, they must be confident that the true probability is less than this value. For example, they would probably use a line of -110 for a 50/50 coin flip, ensuring an expected house edge of 2*0.0238 = 0.476.
Question 1: How good at BTS is Vegas?
I wrote a program to scrape all the data on the website that lists the
historical odds for this bet, which goes all the way back to the beginning of the 2021 season. I then converted the odds to implied probabilities, and used those as estimated hit probabilities. I then computed all the evaluation metrics and visualizations that I talked about in my
previous blog post. Here are the results for the scalar metrics and visualizations respectively:
Top 2/Day Accuracy 0.7387295081967213
Top 5/Day Accuracy 0.7098360655737705
Top 300 Accuracy 0.7266666666666667
Accuracy(proba>0.78) 0.7222222222222222
Count(proba>0.78) 1476
Likelihood 0.0
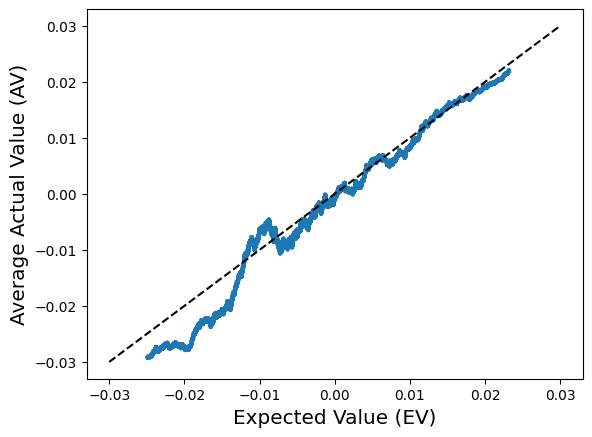
Calibration Curve
These metrics/visualizations demonstrate that Vegas is not all that good at BTS. The accuracy metrics all hover around 72%. The probabilities are not all that well calibrated --- this is not surprising, the small bias can be attributed to the house edge. Finally the predicted probabilities of the best hitters are often well above 80%, even though the corresponding empirical frequencies are well below 80%.
I will point out that I only had data for 2021-2023, which as I showed in a
previous blog post, had the lowest offensive production in recent history. Thus, some of the poor performance can be attributed to that. However, 72% accuracy is definitely not going to cut it if someone wants to actually beat the streak.
Question 3: Are my BTS models profitable on these Bets?
Next, I will look into if the models I have already developed for BTS would have been profitable on these bets. To do this, I will take the predicted probabilities from one of my models on the 2021 and 2022 seasons (I haven't run 2023 yet for this model since it requires retrosheet data which hadn't been released yet when I ran the simulation). I will then use these predicted probabilities, along with the wager/payout implied by the vegas odds to calculate an "expected value".
The histogram below demonstrates that the model does identify some settings where it thinks there is an opportunity for profit. Although most settings are not profitable, which is to be expected since the vegas odds are expected to be well calibrated and the sports book takes their cut.
Next, we filter out the data for only those which the model thinks are positive EV, and then we calculate the profit if we were to take that bet, along with the expected profit according to the model. We consider two betting schemes: (1) constant unit sized bet and (2) quarter Kelly betting with a 100 unit bankroll. For those who don't know, Kelly betting means we scale our wager with our perceived advantage. So if the EV for a unit sized bet is 0.01, then we would bet 1% of our bankroll. A Quarter Kelly betting system is more conservative: we will bet 1/4 of the suggested Kelly bet, or 0.25% in the example above.
The plot above shows that the first/best ~300 or so bets would have been profitable, but after that Vegas would have gotten the better of us. It also shows that Kelly betting would have been far better than unit sized bets, and that the total profit could have been > 100 units. With a 100 unit bankroll, that's a solid >100% ROI. Finally, it does show that the models are over-confident: the expected profit still far exceeds the actual profit, suggesting more room for improvement.
Summary of Highest EV Picks
It's a little too early to get overly optimistic about the promising results from the plot above. To gain more confidence about the performance of the model, it is probably necessary to dive a little deeper into the highest EV picks it identified and try to explain what happened and why those bets situations were different from others. As a starting point, I am including a table with the top 10 best bets identified by the model.
| Date | Batter | Hit | Predicted Probability | Vegas Odds | EV | AV |
|---|
| 2021-09-20 | Kyle Isbel | True | 0.622304 | +110 | 0.306839 | 1.1 |
| 2021-09-14 | Willians Astudillo | True | 0.685790 | -110 | 0.309236 | 0.909091 |
| 2022-08-23 | Josh Rojas | True | 0.715037 | -120 | 0.310901 | 0.833333 |
| 2022-04-29 | Nicky Lopez | False | 0.693140 | -110 | 0.323268 | -1.0 |
| 2021-05-18 | Blake Snell | False | 0.418036 | +220 | 0.337715 | -1.0 |
| 2022-05-15 | Jorge Mateo | False | 0.626604 | +120 | 0.378528 | -1.0 |
| 2021-06-22 | Bobby Bradley | False | 0.671360 | +115 | 0.443423 | -1.0 |
| 2021-09-14 | Rob Refsnyder | True | 0.646607 | +125 | 0.454866 | 1.25 |
| 2021-05-29 | Tomás Nido | True | 0.578324 | +160 | 0.503642 | 1.6 |
| 2021-05-21 | Carlos Martinez | False | 0.453439 | +300 | 0.813754 | -1.0 |
In this blog post, I dove into the world of sports betting, where there seems to be something for everyone. This peaked my curiosity for multiple reasons: I thought Vegas might have some insight into beat the streak that could be useful to me. Second, the existence of these bets could be a good way to monetize my BTS side project, which I have spent considerable time and effort on over the years. My odds of actually beating the streak are slim to none even with a really good prediction model, but these bets are something concrete I could apply them to and potentially make some smaller amounts of money. In this blog post, I explored these questions and determined Vegas is not really all that good at BTS, but that the models I have been developing could find profitable opportunities on sports book bets. This is something I will likely continue exploring and will report back on my success or lack thereof in a future post.


Comments
Post a Comment