Beat the Streak Day Fourteen: Singlearity
After a fortnight of work, I am back with another blog post on MLBs beat the streak contest. And before you ask, yes that is still a thing in 2023. No one has won it yet, and this year the longest streak was 44, 13 shy of of the number needed and 7 short of the previous all time leader in BTS. In short, it doesn't seem like we're any closer to winning it now than we were 10 years ago.

In the last few days, I have been thinking about new algorithms, models, and approaches to this longstanding problem. But before I can or should test these new approaches, it's important to better understand the limitations of simpler approaches when done very carefully. Singlearity was the first approach to this problem I've seen that convincingly demonstrated solid performance where it matters.
The idea is to apply standard neural network training techniques on a dataset of (batter, game, outcome) data. The neural network is trained on carefully feature engineered data. Specifically, the features are averages of various performance metrics in {30 day, 1 year, and 3 year} intervals. These types of "sliding window" features can be broken down at the granularity of "batter", "pitcher", "ballpark", "batter team", or any other features that should be modeled. Additional information about the order in the lineup, and the batter/pitcher dexterity, etc. are also included as features. In the writeup, this model achieved a BTS accuracy of 79.3%, which is much better than the baselines and very solid performance overall.
I tried to reproduce the model and results, and was able to achieve ~78-80% BTS accuracy on a held-out test set. In this blog post, I will refer to my re-implementation of Singlearity as Singlearity-Lite. In this experiment, as in the original writeup, the data was randomly partitioned into train/validation/test sets. This theoretically runs the risk of test set leakage, where some information from the validation+test sets is leaked into the training set via the engineered features.
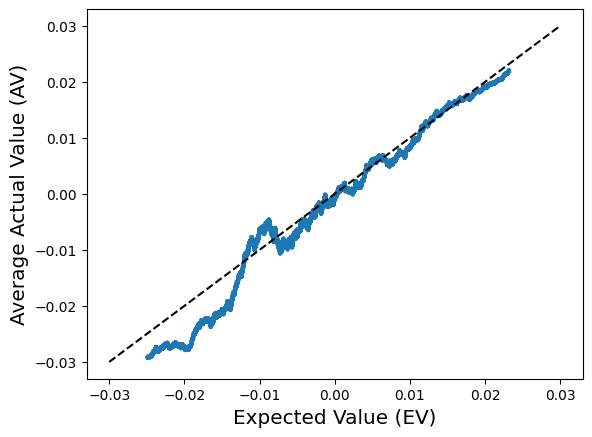
To determine if this could partially explain the strong performance, or if the performance carries over to more realistic settings, I tried doing a temporal train/test split where all training data appears before all test data. The model did not do nearly as well in this setting, achieving about 74% BTS accuracy on 2022 data. However, this was not the end of the story. I realized that overall offensive production has been going down in recent years as teams have been making data-driven defensive optimizations, and that 74% could be simply explained by the relatively lower league-wide averages. The plot below shows this pretty clearly:
This is one likely explanation for why the performance degraded when using a temporal train test split with 2020-2022 data as the test set. It's unclear if this explains most of the degradation, or if test set leakage could also be a secondary contributor.
I decided to dig up more data to get to the bottom of this, and collected data going all the way back to the year 2000. Previously, 2010 was the earliest year I had data for. While PitchFX data is not available before 2008, many models I've considered so far (including Singlearity-Lite) haven't used pitch-level data, and those could benefit from more data. I then evaluated the model on data from 2008, 2009 and 2010. Early results looked extremely promising: specifically, among the most promising batter/game pairs identified by Singlearity-Lite (i.e., those with predicted probabilities >= 78%), 83.7% (out of 43) got a hit in 2008, 86.8% (out of 38) got a hit in 2009, and 100% (out of 1) got a hit in 2010. It's possible that further improvements could be made with more tuning, and is something I will continue to play around with. These numbers reveal a few things worth pointing out:
1. At first glance, Singlearity seems to be quite good.
2. Singlearity did not predict many batters to have a hit probability >= 78% --- only a single batter meeting this criteria was identified in all of 2010.
3. A simple baseline also performed very well in this date range. Specifically, the model estimates hit probability based on 1 year of historical data from that batter (ignoring all other context). For each batter/game pair identified by this model to have hit probabilities >= 78%, 81.4% (out of 161) got a hit in 2008, 87.7% (out of 146) got a hit in 2009, and 80.2% (out of 162) got a hit in 2010.
The trivial baseline performed very well (if not better) than Singlearity in this date range. It's interesting to note that this baseline model hasn't identified a single batter with >=78% chance of getting a hit since 2016. Thus, it's too early to determine how useful my re-implementation of Singlearity-Lite will be, but I learned some interesting things along the way and took the opportunity to spruce up my code, which is checked in on GitHub.
I've dumped a table of full results for all models I've evaluated thus far in this Google Sheet. I'm hoping to update this sheet with more results over time.
Comments
Post a Comment