Recall from Beat the Streak: Day 12, that my grand vision requires building a collection of several models for different sub problems, which will all be combined to get a model for the probability that a batter will get a hit in a given game. In this blog post, my aim is to tackle the first subproblem. Specifically, I'd like to build a model to predict the probability that a ball put into play results in a hit, given it's launch angle, spray angle, launch speed, and any other relevant context (like the ballpark). Note that statcast data already has a column called "estimated_ba_from_speedangle". This only looks at launch angle and launch velocity, and ignores spray angle. It therefore acts as a good baseline for this problem that we can hopefully improve upon. An even more naive baseline is to assume the probability of a hit is constant given it was put into play, ignoring all other context. Evaluating these models gives a negative log likelihood of 0.409 and 0.632, respectively.
Simple feed forward neural network
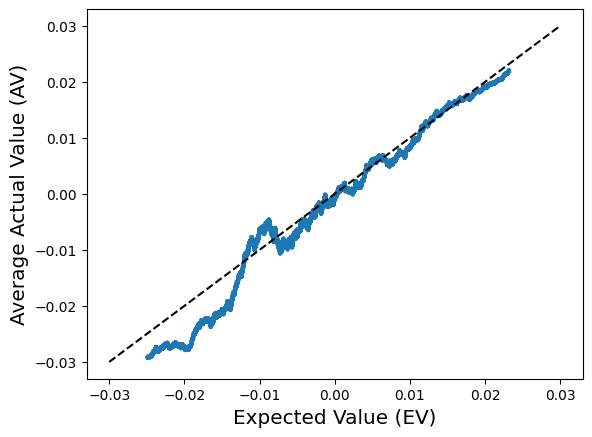
The first non-baseline model we will consider is a fully connected neural network, trained on inputs (launch_angle, spray_angle, launch_speed). This model achieves a negative log likelihood of 0.341, a noticeable improvement over the other two baselines. One natural way to interpret this difference in models performance is via the likelihood ratio, which roughly speaking is a measure of how much more likely we were to observe data under one model as opposed to another. The average likelihood ratio across all data points in our test set is $ \exp{(0.409 - 0.341)} = 1.07 $, i.e., our new model is 7% better than the baseline according to this metric. While it's not huge, this is a game of percentages, and every percentage counts. Here is a plot that shows the distribution of estimated probabilities for the two models across the test set.
What other factors help?
We now augment our neural network with the additional features windspeed, temp, ballpark, winddir, precip to see if these extra features help, and if so, but how much. Interestingly, when we train the same neural network with this feature set, it achieves a negative log likelihood of 0.346 on the test set, which is actually worse than what we got with the simpler feature set. This is somewhat unexpected and suggests that the relationship between these features and the outcome is weak, or the it is subtle and difficult for the model to pick up on it during training. It's also a sign that the model we are using is suboptimal, and could be a potential area to look into in the future.
Other extensions?
Further improvements to the model are certainly possible. I didn't really do any hyper-parameter tuning on the neural networks, so that is something that can be fiddled with to boost performance. For now, I don't want to spend too much time on any single submodel so I can stay on track to execute my grand vision. There is certainly space to improve on this subproblem, and may revisit it down the line.
Open sourcing the data and code
One thing I'm doing differently in this blog post, and I'd like to continue to do moving forward is providing a link to the code that was used to write this blog post. This is useful if anybody else wants to take a crack at this subproblem and improve the model I came up with, or if I want to revisit this idea in the future I'll know exactly what I ran.

Comments
Post a Comment