Beat the Streak: Day Three
In order to maximize your probability of beating the streak, you should (1) predict the probability that a batter will get a hit in a given game given the game parameters and (2) determine if it's worthwhile to risk your current streak in order to possibly improve it by 1 or 2 games. In this blog post, I outline my solution to (2). In previous blog posts, I've hinted at what I do to solve (1) and will continue that discussion in a later blog post.
Let's make the assumption that the probability of the best choice getting a hit on a given day is a uniformly random variable in the range $[0.78,0.85]$. That means that the probability of the best player getting a hit on a given day is going be somewhere in that range. Intuitively, when your streak is large, you should wait for a player with really good odds (in this case, $84\%$ or higher). The method I describe in this section is a general one, and it can be used for any distribution, but for the purpose of concreteness, I will proceed under the assumption that the distribution is $U[0.78,0.85]$. This choice is admittedly somewhat arbitrary since I haven't gotten around to figuring out what the distribution should be, but I suspect it will be close enough to the true distribution to provide a good approximation. I will further assume that you can only select up to one player per day (this rule changed a few years ago to give fans better odds), as this simplifies the math significantly.
For any given streak there is some threshold probability; if the batter with the best odds has a probability of a hit above this threshold, then we should pick them. Otherwise, we should not pick anybody for the current day. Technically, this streak also depends on the number of games remaining in the season.
Define $W(s,g)$ as the probability of beating the streak under the optimal strategy given that your current streak is $s$ and there are $g$ games remaining in the season. It follows immediately that
$$ W(57, \_) = 1 \\
W(\_, 0) = 0 $$ Further, assume we know the threshold probability for the given $(s,g)$ pair. Let's denote that by $p$. Additionally, let's denote the probability density function from above, $U[0.78,0.85]$, as $f$. With these constructs at hand, we can define the general definition of $W$:
$$ W(s, g) = \int_0^p f(q) W(s, g-1) dq + \int_p^1 f(q) (q W(s+1, g-1) + (1-q) W(0, g-1)) dq $$
Now that we have an expression to calculate $W$ given the threshold probability $p$, we can find the optimal value of $ p$ by maximizing $W$. This is a simple calculus problem that leads to solution:
$$ p = \frac{W(s, g-1) - W(0, g-1)}{W(s+1, g-1) - W(0, g-1)} $$
Now that we've derived the formulas, we can code a dynamic programming algorithm to compute the values of $W$ and the associated values of $p$ for all $(s,g)$ pairs. Since I've made the assumption that the probability distribution is uniform, it's possible to derive a closed form for the integral above. If you have reason to use a more exotic distribution, you might have to resort to numerical integration techniques.

Motivation
When your current streak is short, the optimal strategy is to pick the best player every day, regardless of how likely their probability of getting a hit is (to a certain extent). However, as your streak grows, you have an important decision to consider: is it better to pick the best player today and possibly lose your current streak, or skip picking a player and instead maintain your current streak. Naturally, this decision should be guided by the players probability of getting a hit, as well as the distribution of these probabilities over the course of a season.The Solution
In order to solve this problem, we must first have a way to approximate the probability of a given player getting a hit in a given game -- and consequently, determine which player has the best odds on a given day. In my last blog post on this topic, I introduced how to partially answer these questions and will more completely address them in my next post.Let's make the assumption that the probability of the best choice getting a hit on a given day is a uniformly random variable in the range $[0.78,0.85]$. That means that the probability of the best player getting a hit on a given day is going be somewhere in that range. Intuitively, when your streak is large, you should wait for a player with really good odds (in this case, $84\%$ or higher). The method I describe in this section is a general one, and it can be used for any distribution, but for the purpose of concreteness, I will proceed under the assumption that the distribution is $U[0.78,0.85]$. This choice is admittedly somewhat arbitrary since I haven't gotten around to figuring out what the distribution should be, but I suspect it will be close enough to the true distribution to provide a good approximation. I will further assume that you can only select up to one player per day (this rule changed a few years ago to give fans better odds), as this simplifies the math significantly.
For any given streak there is some threshold probability; if the batter with the best odds has a probability of a hit above this threshold, then we should pick them. Otherwise, we should not pick anybody for the current day. Technically, this streak also depends on the number of games remaining in the season.
Define $W(s,g)$ as the probability of beating the streak under the optimal strategy given that your current streak is $s$ and there are $g$ games remaining in the season. It follows immediately that
$$ W(57, \_) = 1 \\
W(\_, 0) = 0 $$ Further, assume we know the threshold probability for the given $(s,g)$ pair. Let's denote that by $p$. Additionally, let's denote the probability density function from above, $U[0.78,0.85]$, as $f$. With these constructs at hand, we can define the general definition of $W$:
$$ W(s, g) = \int_0^p f(q) W(s, g-1) dq + \int_p^1 f(q) (q W(s+1, g-1) + (1-q) W(0, g-1)) dq $$
Now that we have an expression to calculate $W$ given the threshold probability $p$, we can find the optimal value of $ p$ by maximizing $W$. This is a simple calculus problem that leads to solution:
$$ p = \frac{W(s, g-1) - W(0, g-1)}{W(s+1, g-1) - W(0, g-1)} $$
Now that we've derived the formulas, we can code a dynamic programming algorithm to compute the values of $W$ and the associated values of $p$ for all $(s,g)$ pairs. Since I've made the assumption that the probability distribution is uniform, it's possible to derive a closed form for the integral above. If you have reason to use a more exotic distribution, you might have to resort to numerical integration techniques.
Results
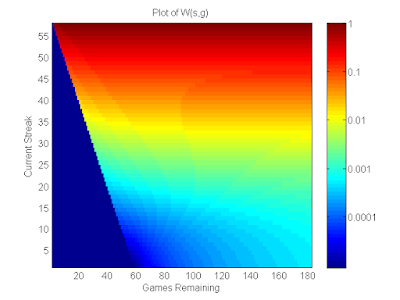
Using the method described above, I found the values of $W(s,g)$ for all $(s,g)$ pairs. I also found the associated probability threshold for each pair.

This plot illustrates how your chances change as the season progresses and your streak grows. Under the original assumptions (mainly the distribution), we can see that the probability of beating the streak at the start of the season is given by:
$$W(0,183) \approx 0.000532$$ The next graph shows the threshold probabilities, and these values dictate whether or not it is favorable to select a player on a given day based on their probability approximations.

The behavior of this graph is pretty intuitive - when the streak is small, the threshold probability is close to the min of $p=0.78$, and as the streak grows, the threshold probability grows with it. The white portion of the graph has an undefined probability threshold since the probability of winning in that region is $0$ - there are not enough games left in the season to accumulate a big enough streak. One key takeaway from this figure is that until the streak surpasses $8$ games, the threshold probability is the minimum possible, indicating you should always risk your streak for the opportunity to advance your streak.
Conclusion
While the results are pretty exciting, there is still more work to be done on this problem. For example, by removing the restriction that you can only pick up to one player per day, we could get a better picture of what the true optimal strategy is. The same method can be extended to allow for this variation, but doing so requires significantly more work. I will probably revisit the idea once I have a better understanding of what the true distribution of the daily hit probability is.
Comments
Post a Comment