Beat the Streak: Day Eight
In this blog post, we will explore three factors that influence the probability of correctly selecting a player to get a hit on a given day. These are:
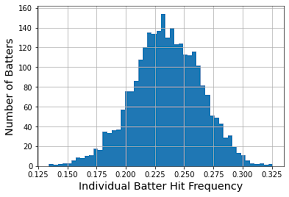
1. Individual batter strength, as measured by the proportion of plate appearances that resulted in a hit.
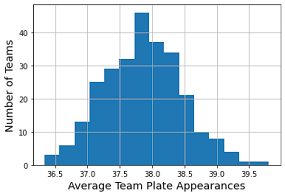
2. Team offensive strength, as measured by the average number of plate appearances per game by the batting team.
3. The position in the batting order.
We plot the distribution of these statistics over (batter, year) pairs and (team, year) pairs. The plots below reveal that the best batters get a hit in about 30% of plate appearances, and the strongest offensive teams average 39 plate appearances per game.
 |
 |
The tables below show the top-performing batters and teams:
|
|
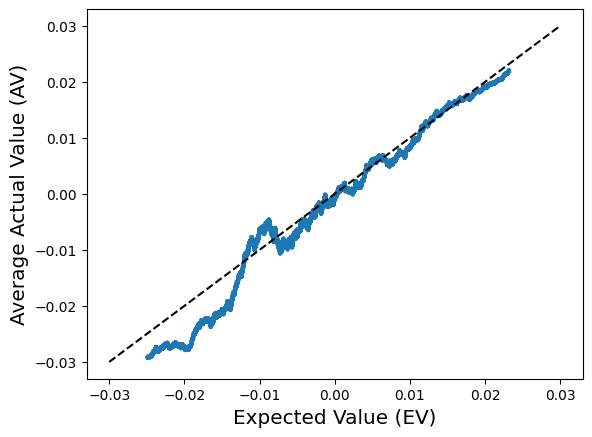
Note that the data I am working with currently covers years 2010 - 2018, which is somewhat stale, but should be sufficient for the purposes of understanding these general factors. For an individual team, we can effectively model the number of plate appearances with a negative binomial distribution. This is a distribution that counts the number of successes (i.e., non-outs) before a pre-specified number of failures (i.e., outs). We set the number of failures, $r$ to be $27$. Note that this model is simply an approximation to the true distribution. In home games, $24$ outs might be sufficient, and in extra-innings games more would be needed. Moreover, this model does not account for the possibility of double and triple plays, nor the fact that different players in the lineup have difference chances of success. Nevertheless, it serves as a simple and reasonable model for this quantity. We can fit the model to data using the moment matching method. Doing this on the 2016 Red Sox data yields the following plot:

$$ n = \lfloor 1 + \frac{N - order}{9} \rfloor $$
Here, "order" is the position in the lineup of the player. We can calculate the probability of each $n$ using the probability mass function of the negative binomial, to estimate the overall probability of a hit:
$$ \sum_{N=27}^{\infty} f(N) (1 - (1 - p)^{ \lfloor 1 + \frac{N - order}{9} \rfloor }) $$
$f(N)$ above denotes the PMF of the negative binomial. Plotting this function for a set of reasonable inputs yields the following contour plot:

This plot was constructed under the assumption of a lead-off batter. The color indicates the probability of at least one hit in the game, whereas the x-axis indicates the probability of a hit in a single plate appearance. This plot shows that, roughly speaking, picking a batter with 1% better chance of a hit in one plate appearance is equivalent to picking a team that gets 2 more plate appearances on average. This plot was for the lead-off batter. The plot below shows what the probability of a hit is for batters in different positions in the lineup, assuming $0.3$ hit probability per plate appearances and an average of 38 team plate appearances under the negative binomial model. This plot demonstrates that, all else equal, each position in the lineup costs about 0.8% to the probability of at least one hit.

This blog post suggests that an 80% success rate in BTS should be attainable, by carefully considering the batter, the team, and the position in the lineup. For some reason that number has been elusive to me so far in my efforts to beat the streak. Even though as we saw above that some hitters were able to get hits in 30% of plate appearances in a given season, it's entirely possible that this impressive success rate was due in part by luck, and the true success rate (which is unknown) could be below 30%. This could partially explain why an 80% success rate has been so hard to achieve in BTS.
Comments
Post a Comment