Beat the Streak: Day Seven
In this blog post, I discuss questions of the form: “Does batter X perform better at home or away? At day or night? Against lefties or righties? On Friday or Monday?” What I found was a little bit surprising.
Take for example the batter Daniel Murphy. When you look at his data from 2011 - 2017, you will see that he got a hit in 29.85% of 1424 plate appearances during day games and he got a hit in 26.97% of 2673 plate appearances during night games. This is a pretty meaningful difference, but is it statistically significant? In other words, could this difference be explained purely by chance? To answer this question, we can perform a chi squared test under the null hypothesis that the true probabilities are the same. When we do this we get a chi squared value of 3.35 and a corresponding p value of 0.067. Thus, we can reject the null hypothesis that the true underlying probabilities are the same at the 90% confidence level. This is pretty convincing evidence that the day/night split really matters, at least for Daniel Murphy, right?
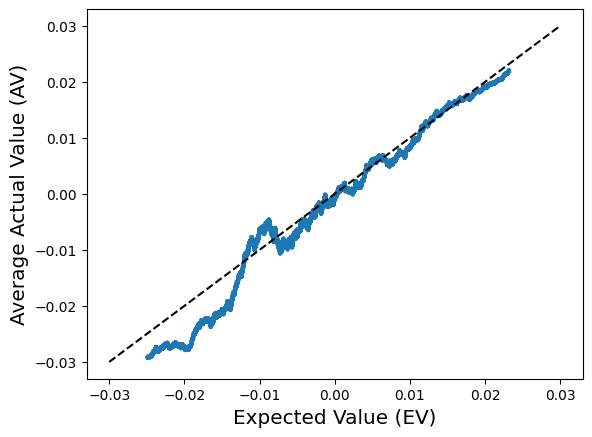
Wrong. When we repeat this analysis for other batters we find that the difference is not usually statistically significant. That is to be expected however, so perhaps it matters for some batters but not for others? To answer this question we should look at the p value for all batters with enough data to satisfy the assumptions of the chi squared test (at least 5 hits at both day and night). If the null hypothesis is true that the underlying hit probability is the same at day and night for all batters, then we still expect the 10% of the p-values to be less than 10% purely by chance. More generally, we expect q% of p-values to be less than q% purely by chance for all q. Thus, if we compute and sort the p-values for all $n$ batters, we expect batter $I$ to have a p-value around $i/n$ under the null hypothesis. Here is the plot:

Because the true p-value appears along the main diagonal, this is very good evidence in support of the null hypothesis, and we are thus unable to reject it. We conclude that day / night does not affect the hit probability. We can repeat this analysis for other possible explanatory features such as weekday, month, pitcher handedness (p_throws), inning, order in lineup, home/away, ballpark, and year. When we do so, we get the following plots:


When the blue points fall below the main diagonal, that is evidence that the feature is important and the null hypothesis can probably be rejected. The further below the main diagonal it is, the stronger the evidence. We conclude that weekday, month, and order don’t really impact the hit probability, but p_throws, inning, home, ballpark, and year do. It is a little surprising that the inning matters — perhaps this is because starting pitchers become more hittable as they get tired or relief pitchers are stronger/weaker than starters on average? The year also matters, which is expected and indicates that (some) batters performance really does change from year to year, and the differences aren’t due purely to chance.
The other thing to note about these plots is that for most batters, there is not statistically significant evidence to reject the null hypothesis, which is an indication that the impact of the features is small. However, as a whole (using all batters), there is enough evidence to reject the null hypothesis. If we wanted to be rigorous, we would have to calculate how far below the main diagonal we’d need to be to reject the null hypothesis. Perhaps we could use area under the curve as a test-statistic? I’m not sure, if you have any ideas feel free to comment below.
Comments
Post a Comment